U.S Small Business Administration
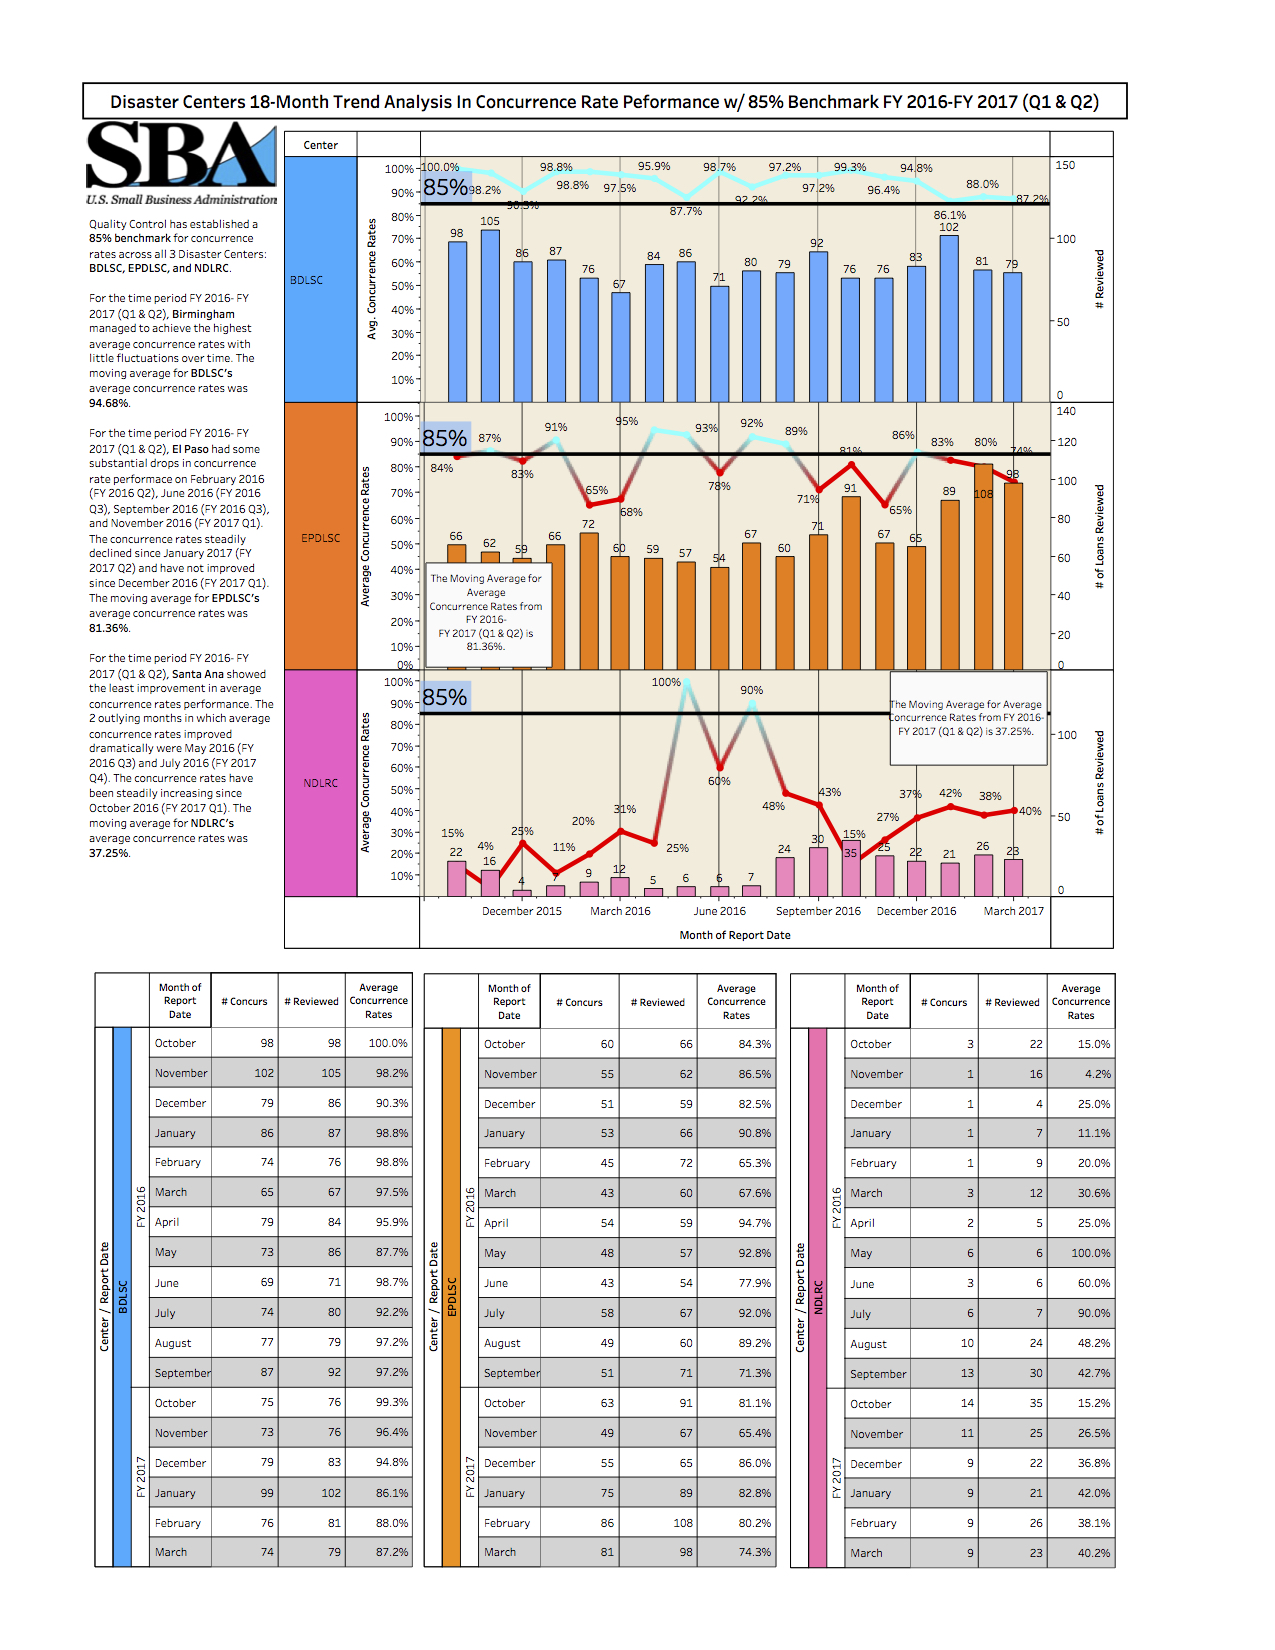
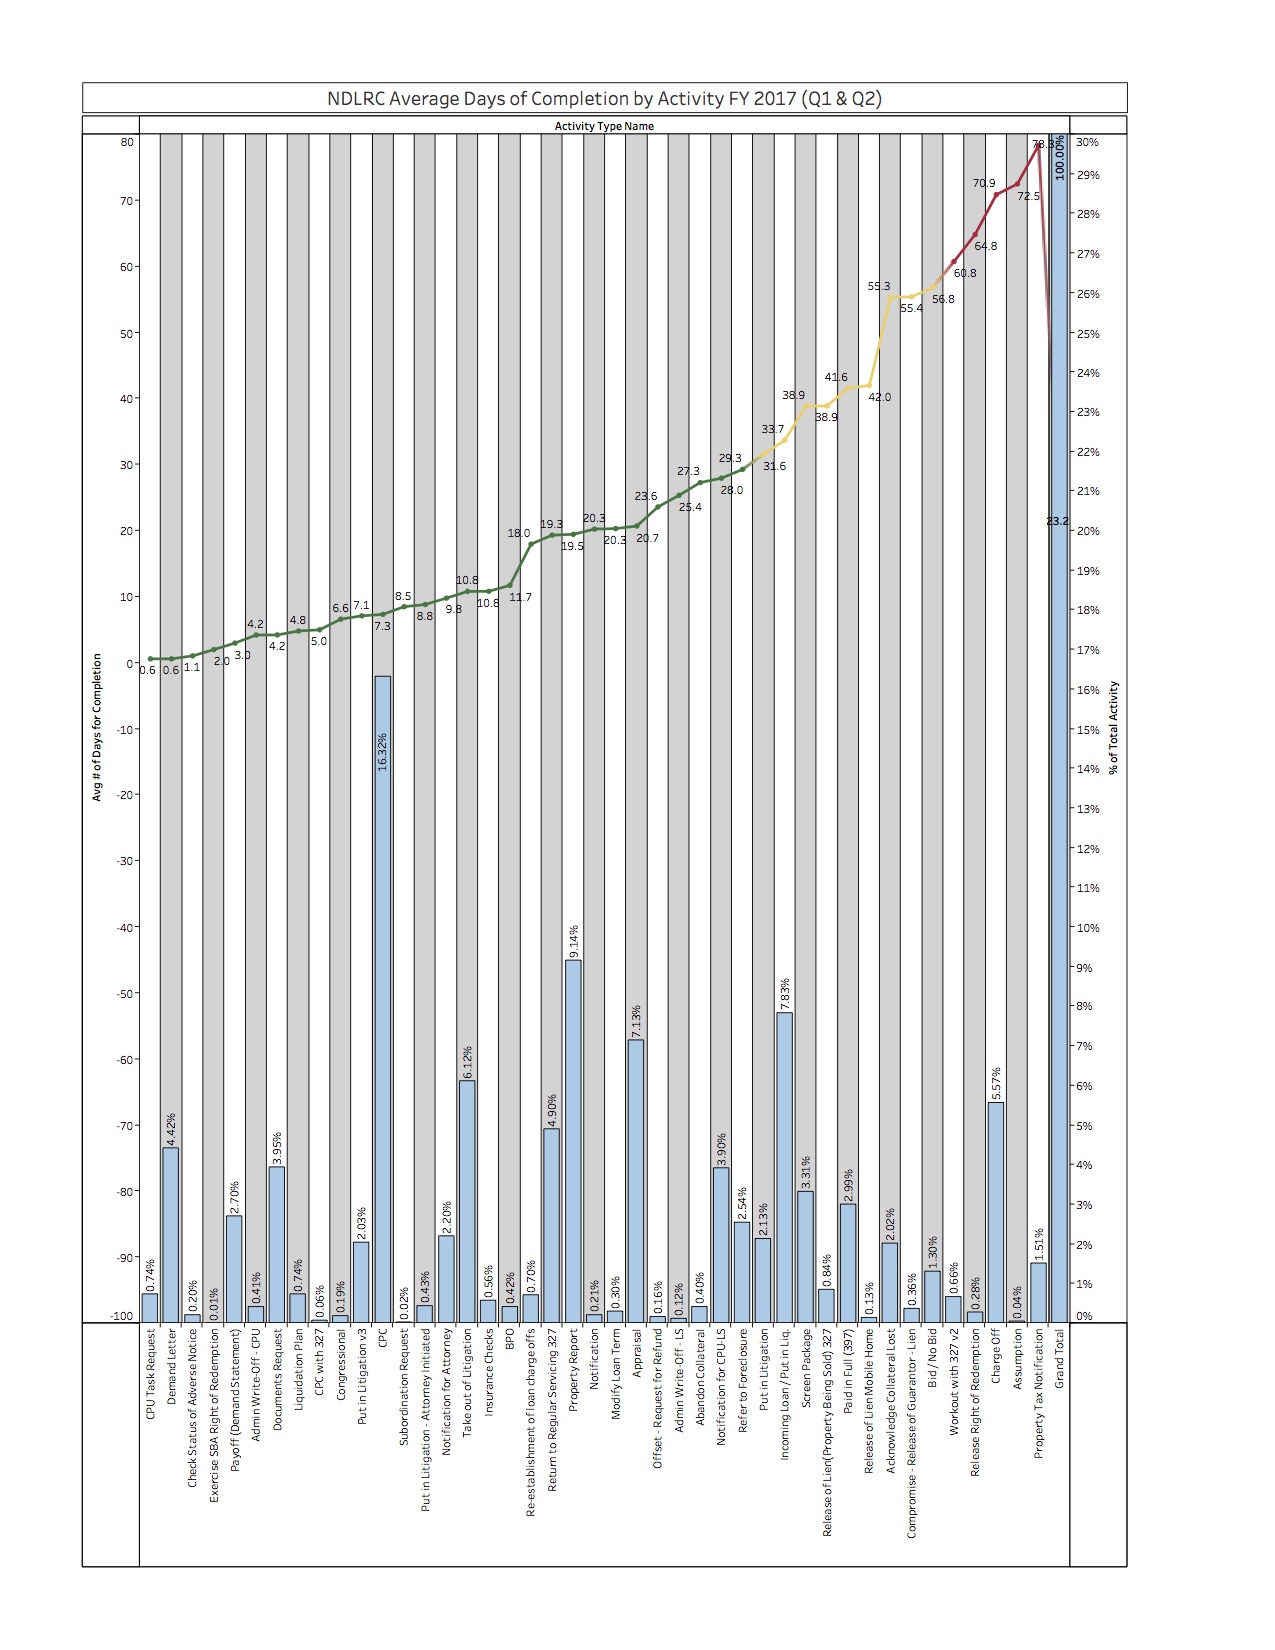
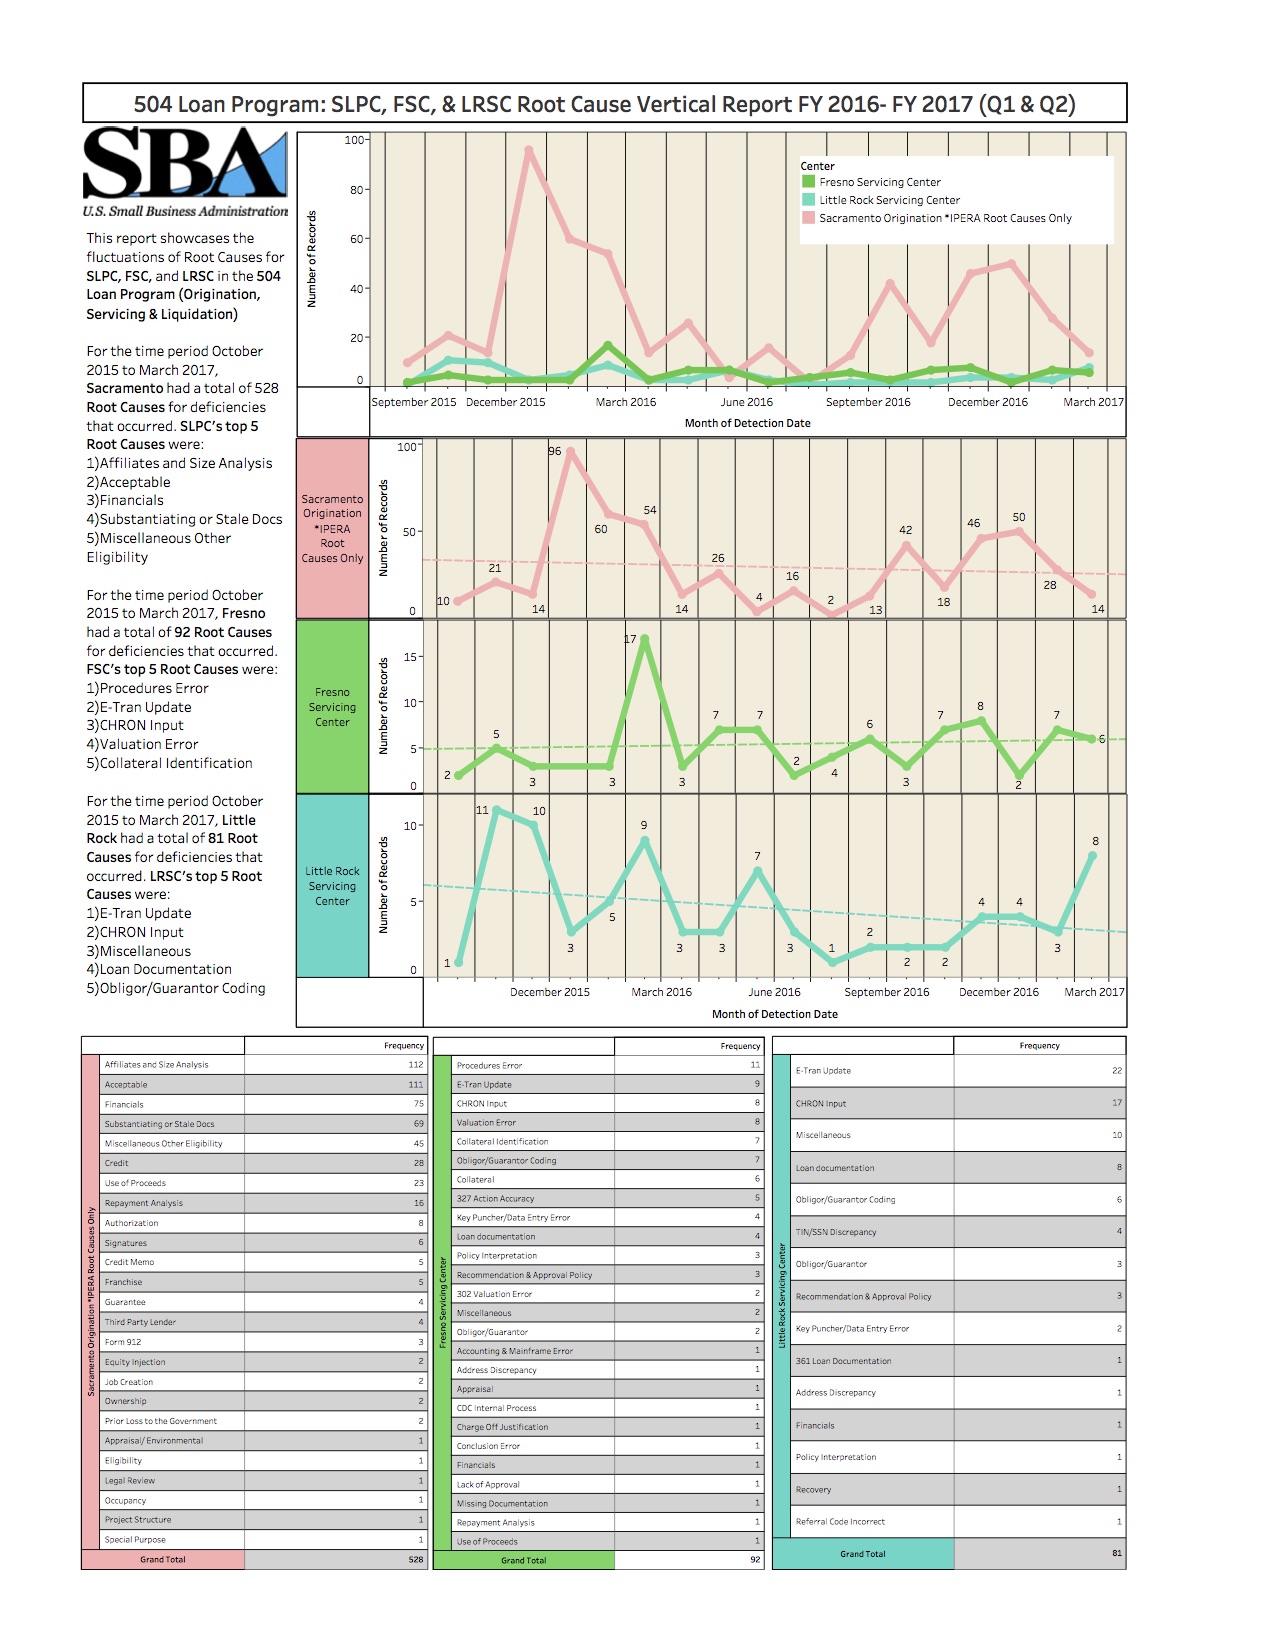
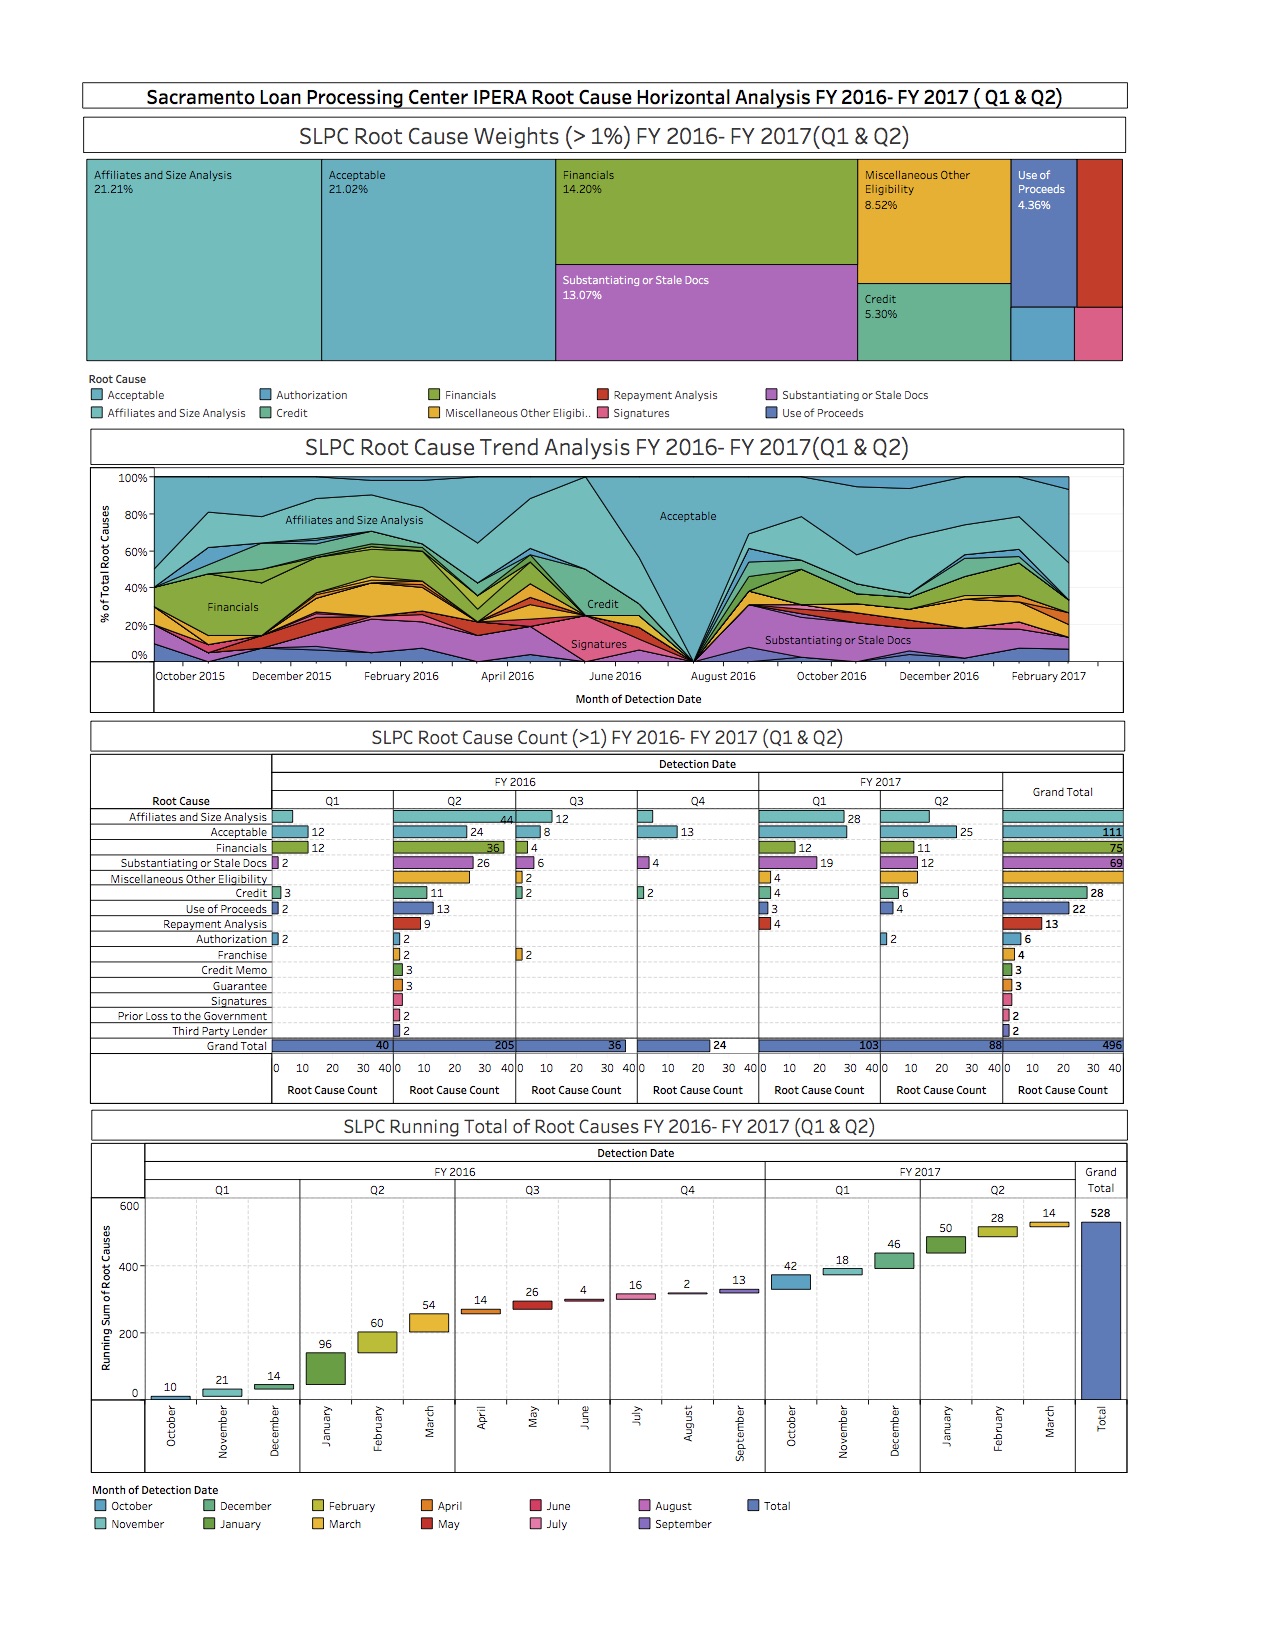
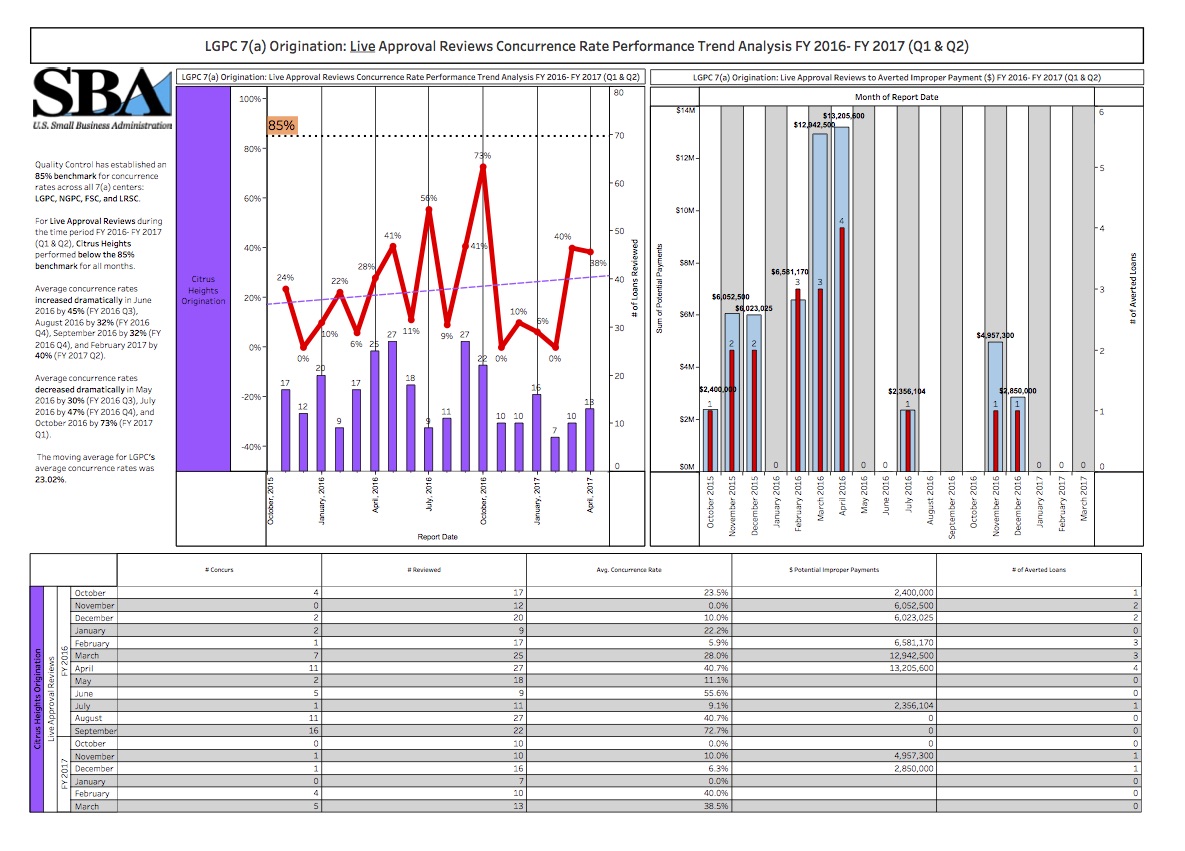
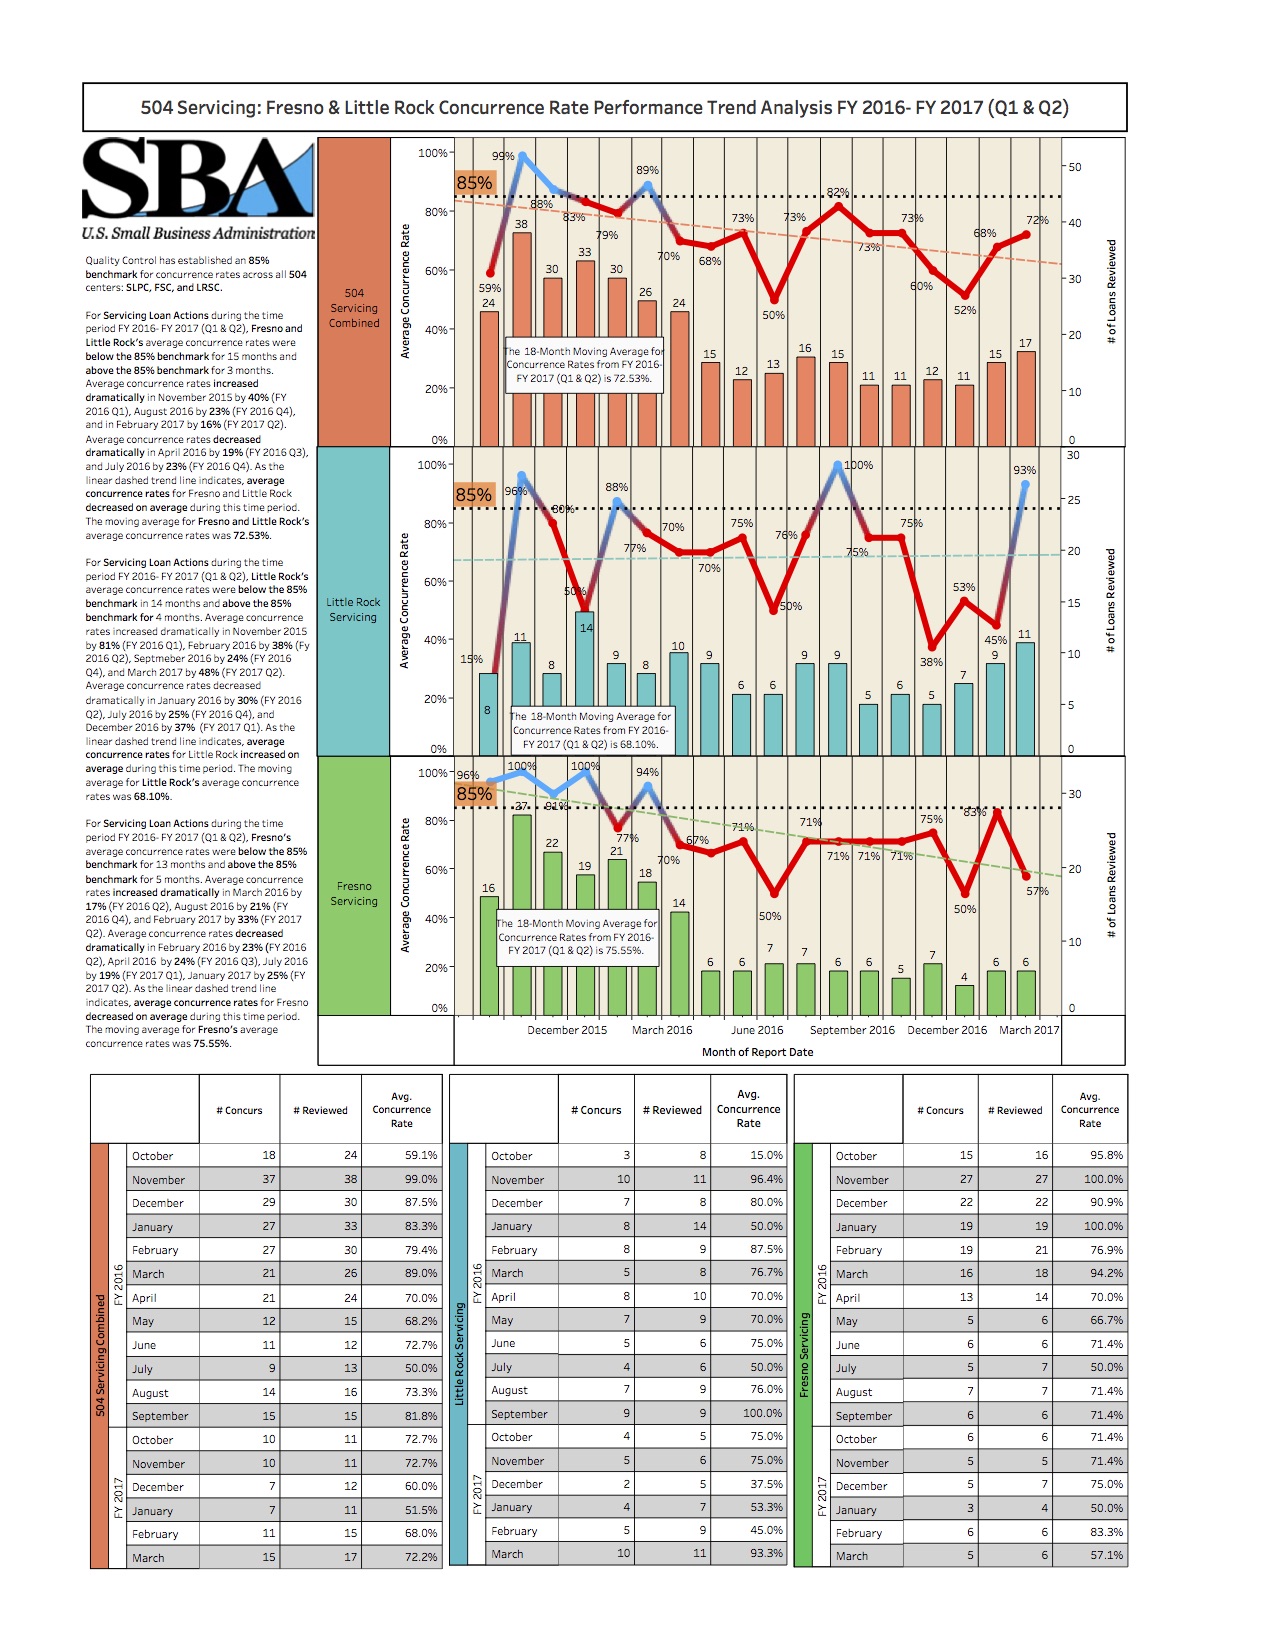
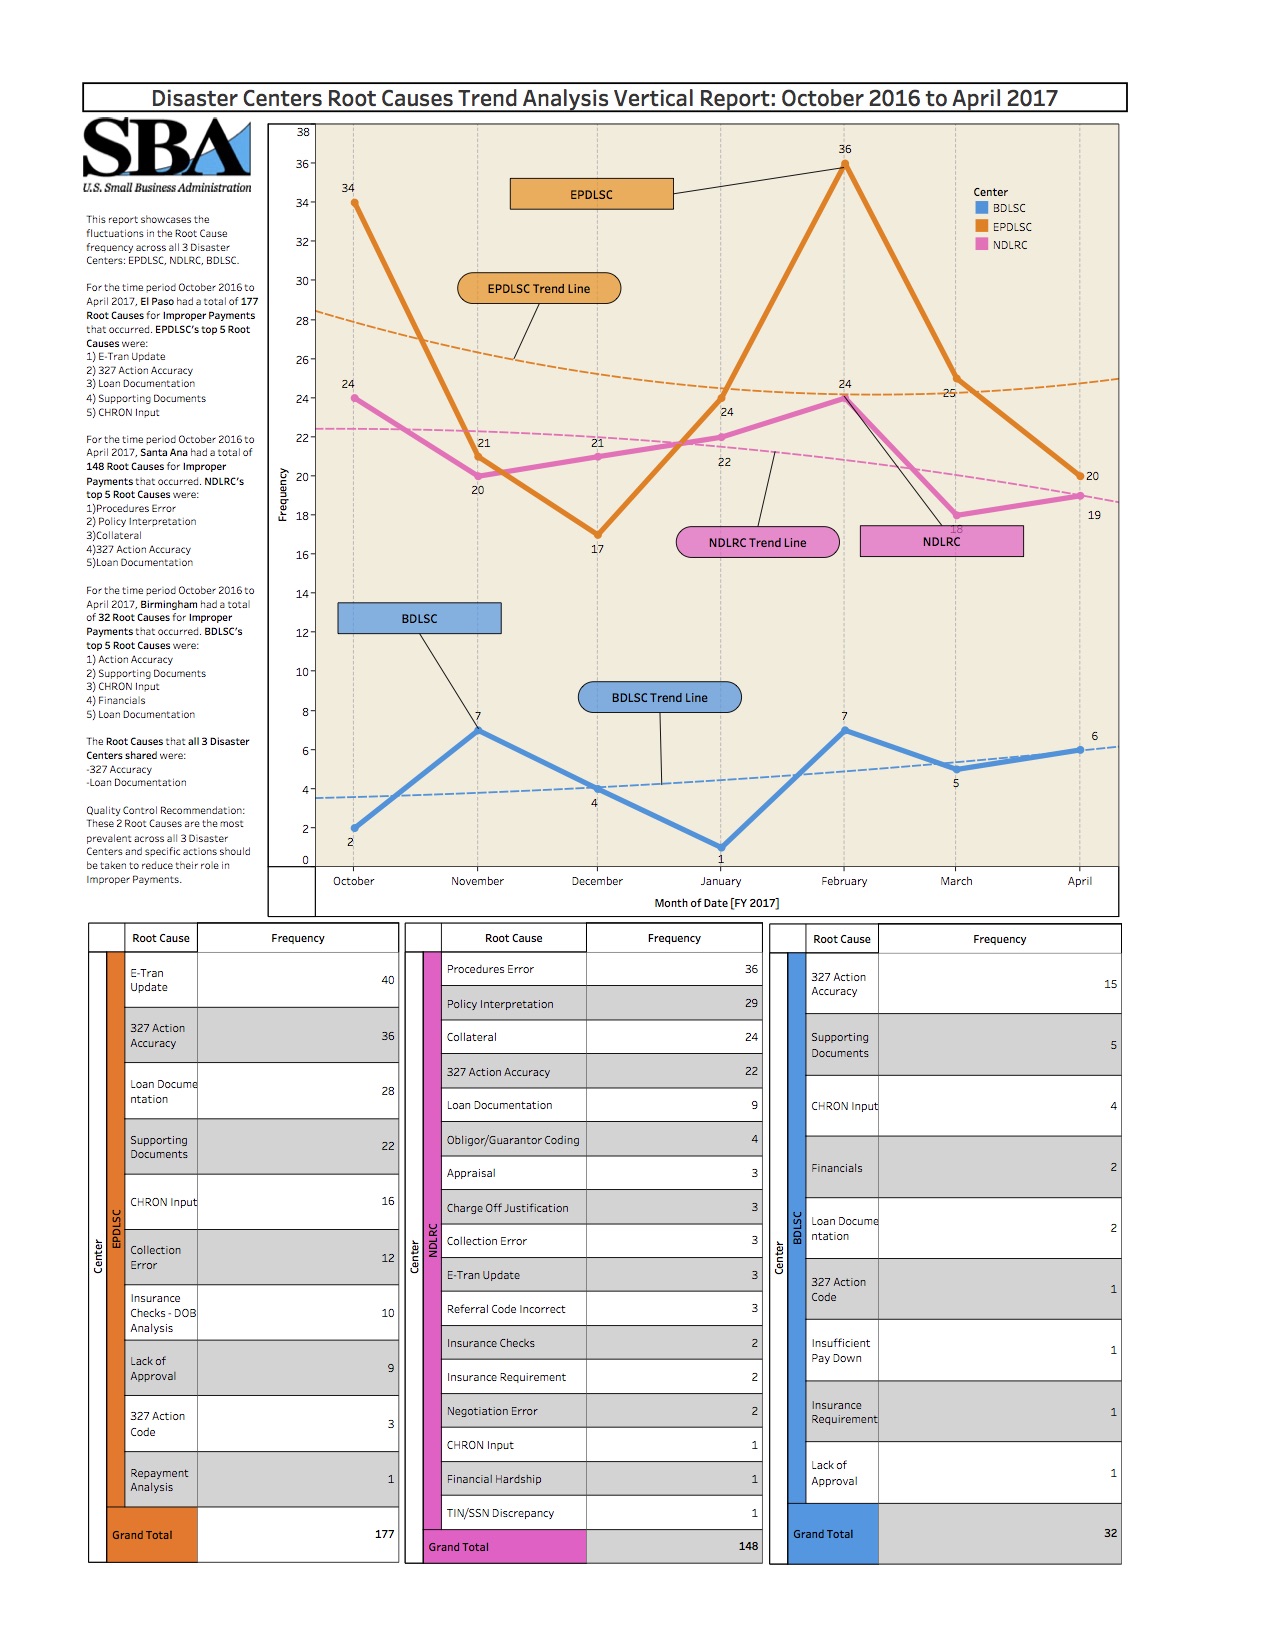
As a Business Analyst for the SBA’s headquarters in Washington D.C., I was responsible for contributing to the integrity of loans and loan programs in the Quality Control Program within the Office of Financial Programs and Operations. I achieved this by focusing on analytics from SBA’s eight centers located throughout the U.S. These eight centers were tailored to different stages of the loan lifecycle and loan products. I extracted data from Sharepoint and used Excel and Tableau to perform vertical and horizontal analysis in order to assess the key performance indicators and perceived risks of all eight centers through dashboards. I also provided management with recommendations that maximized each center’s compliance with SBA’s risk management and internal control procedures. This internship gave me a good understanding of the dynamics of small business financing and the potential of data analytics to solve real world problems. Here are some of the deliverables for the 2nd quarter (Q2) of the Fiscal Year 2017 (FY2017) that I developed using Tableau:
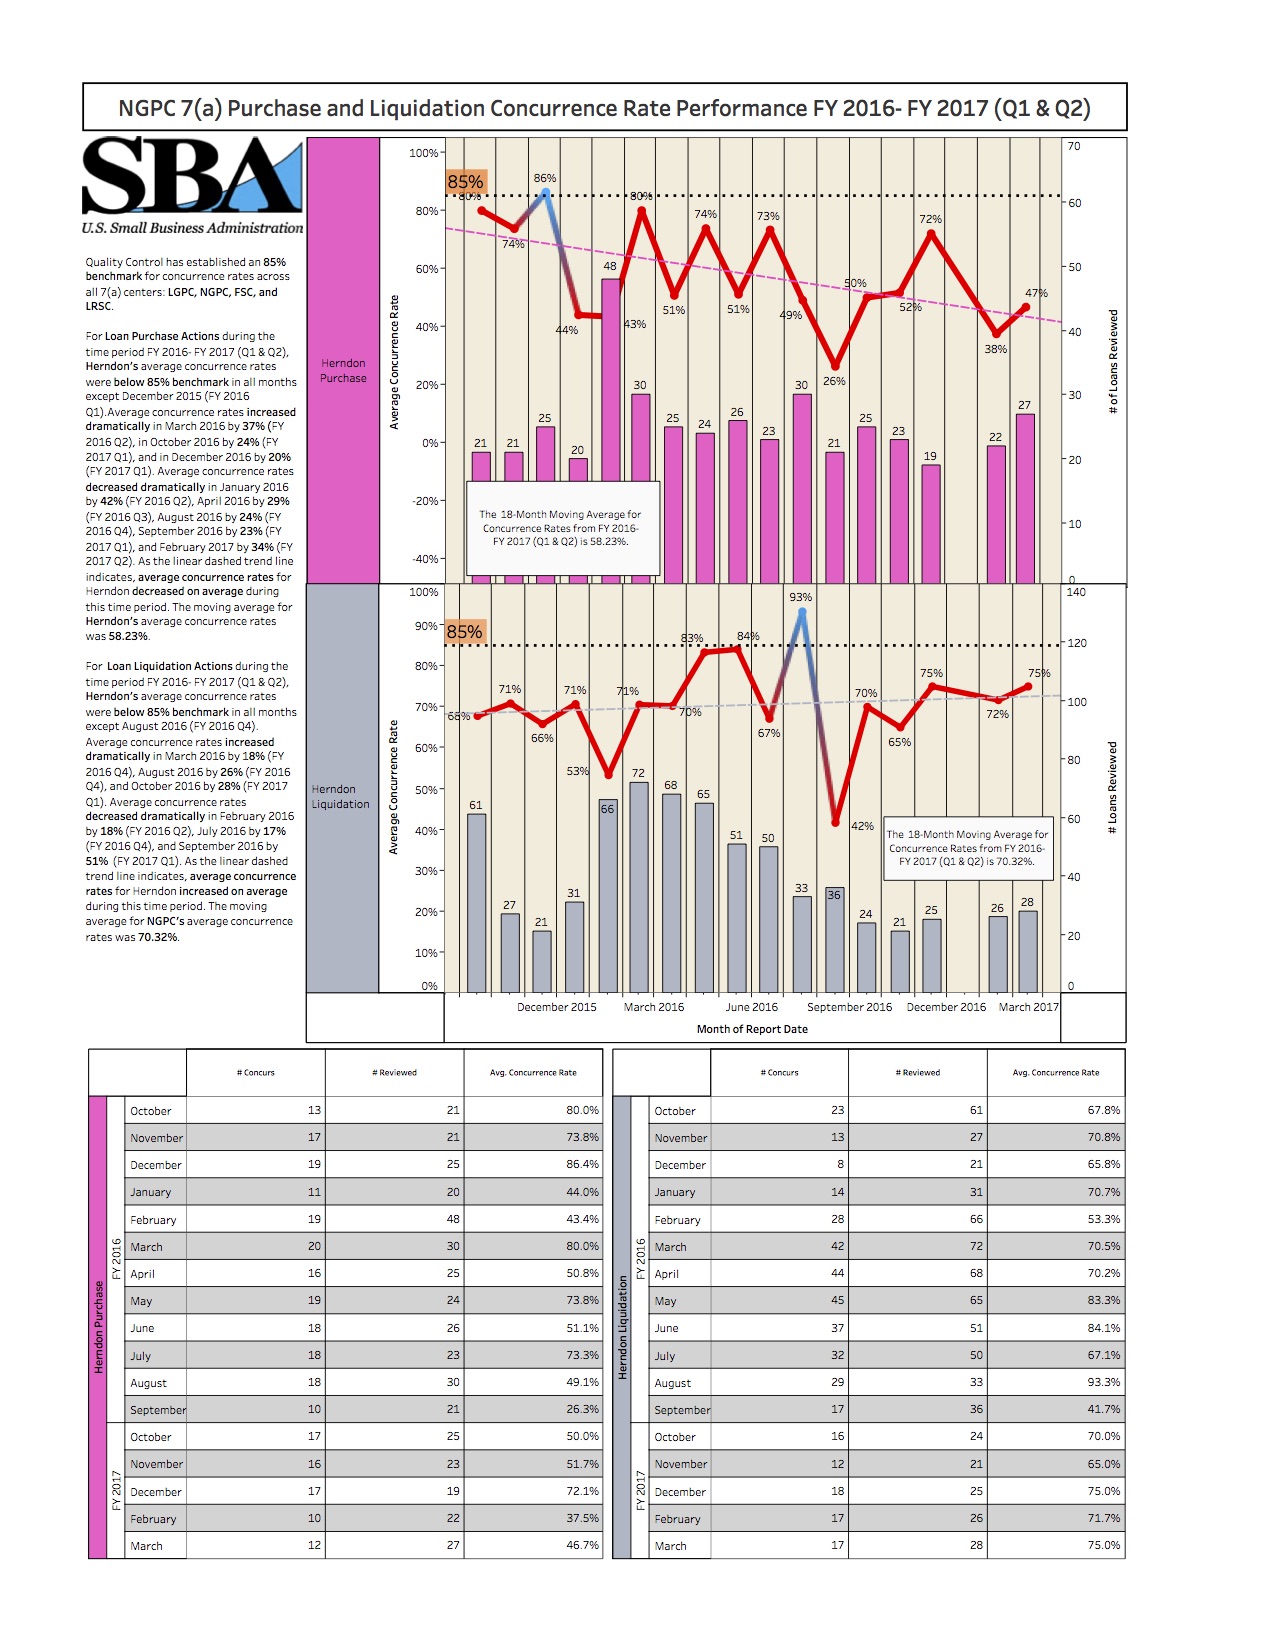
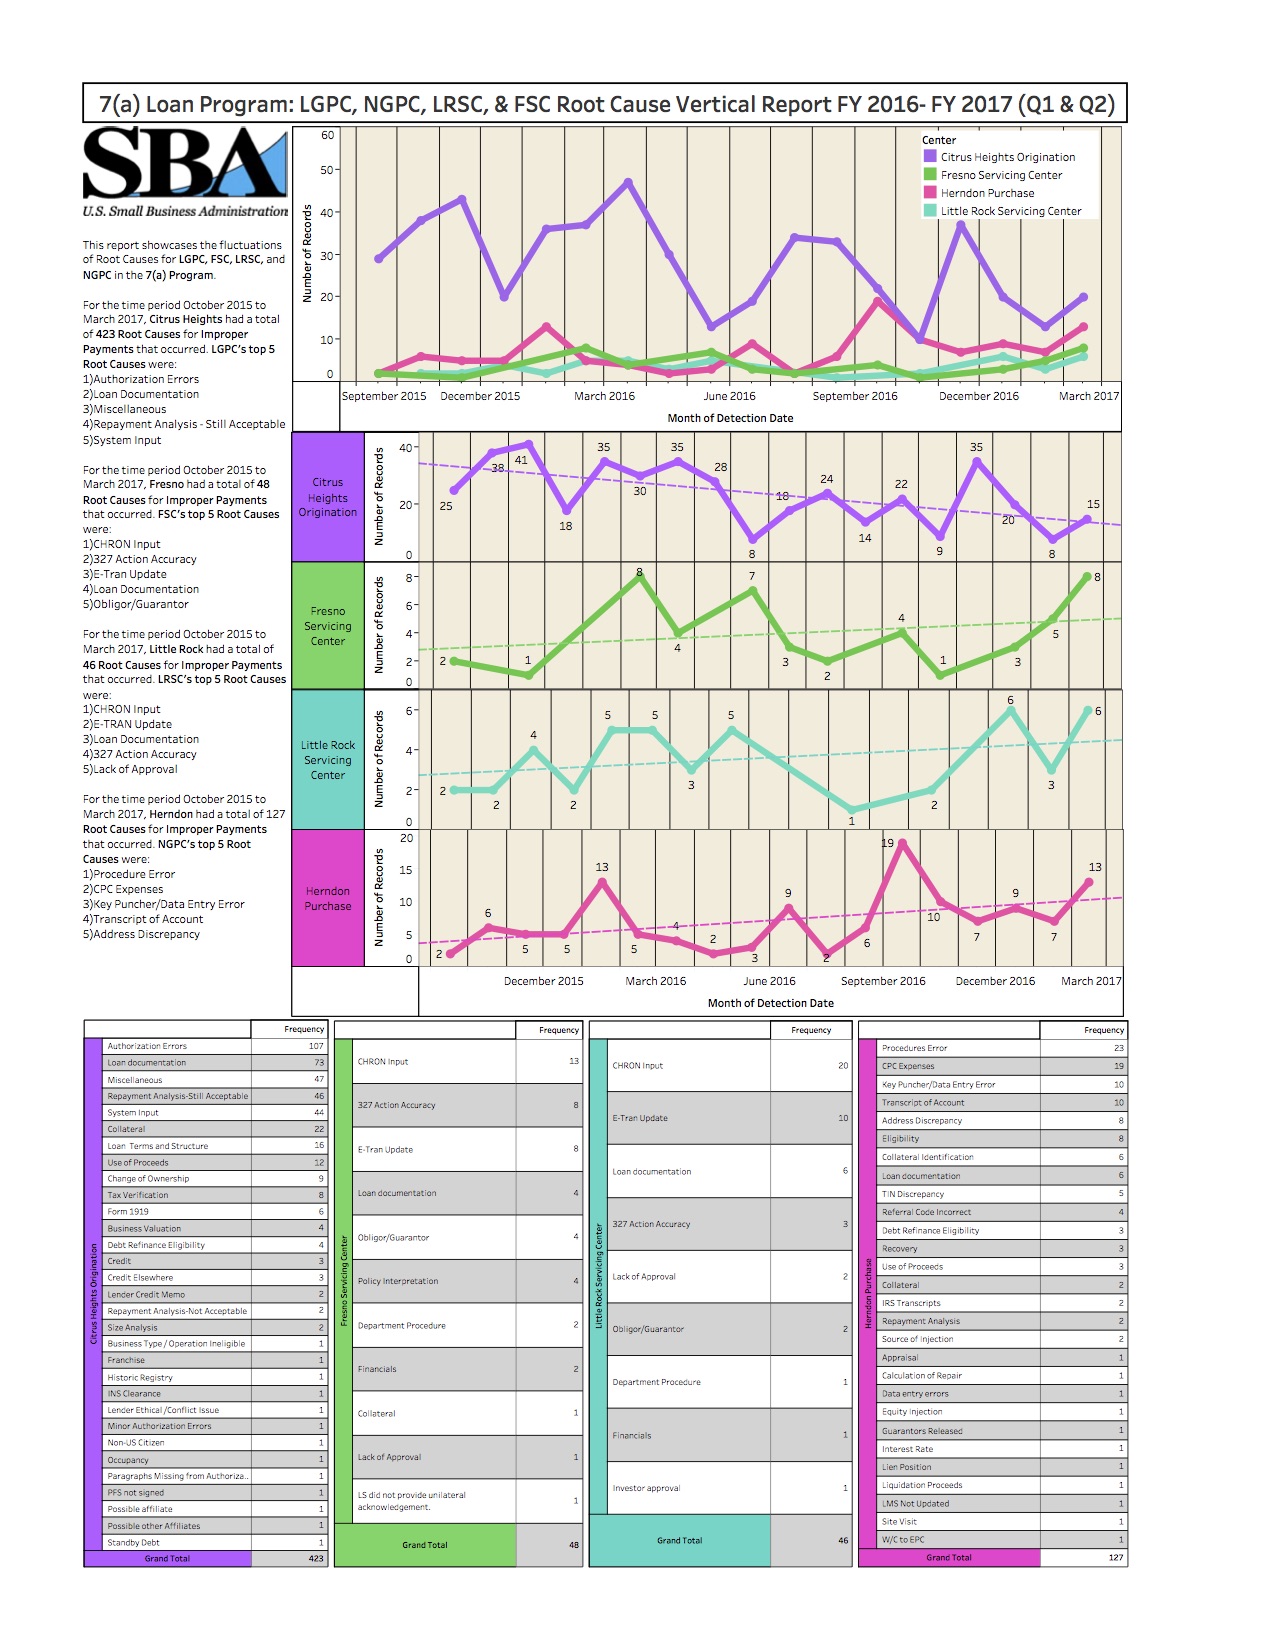
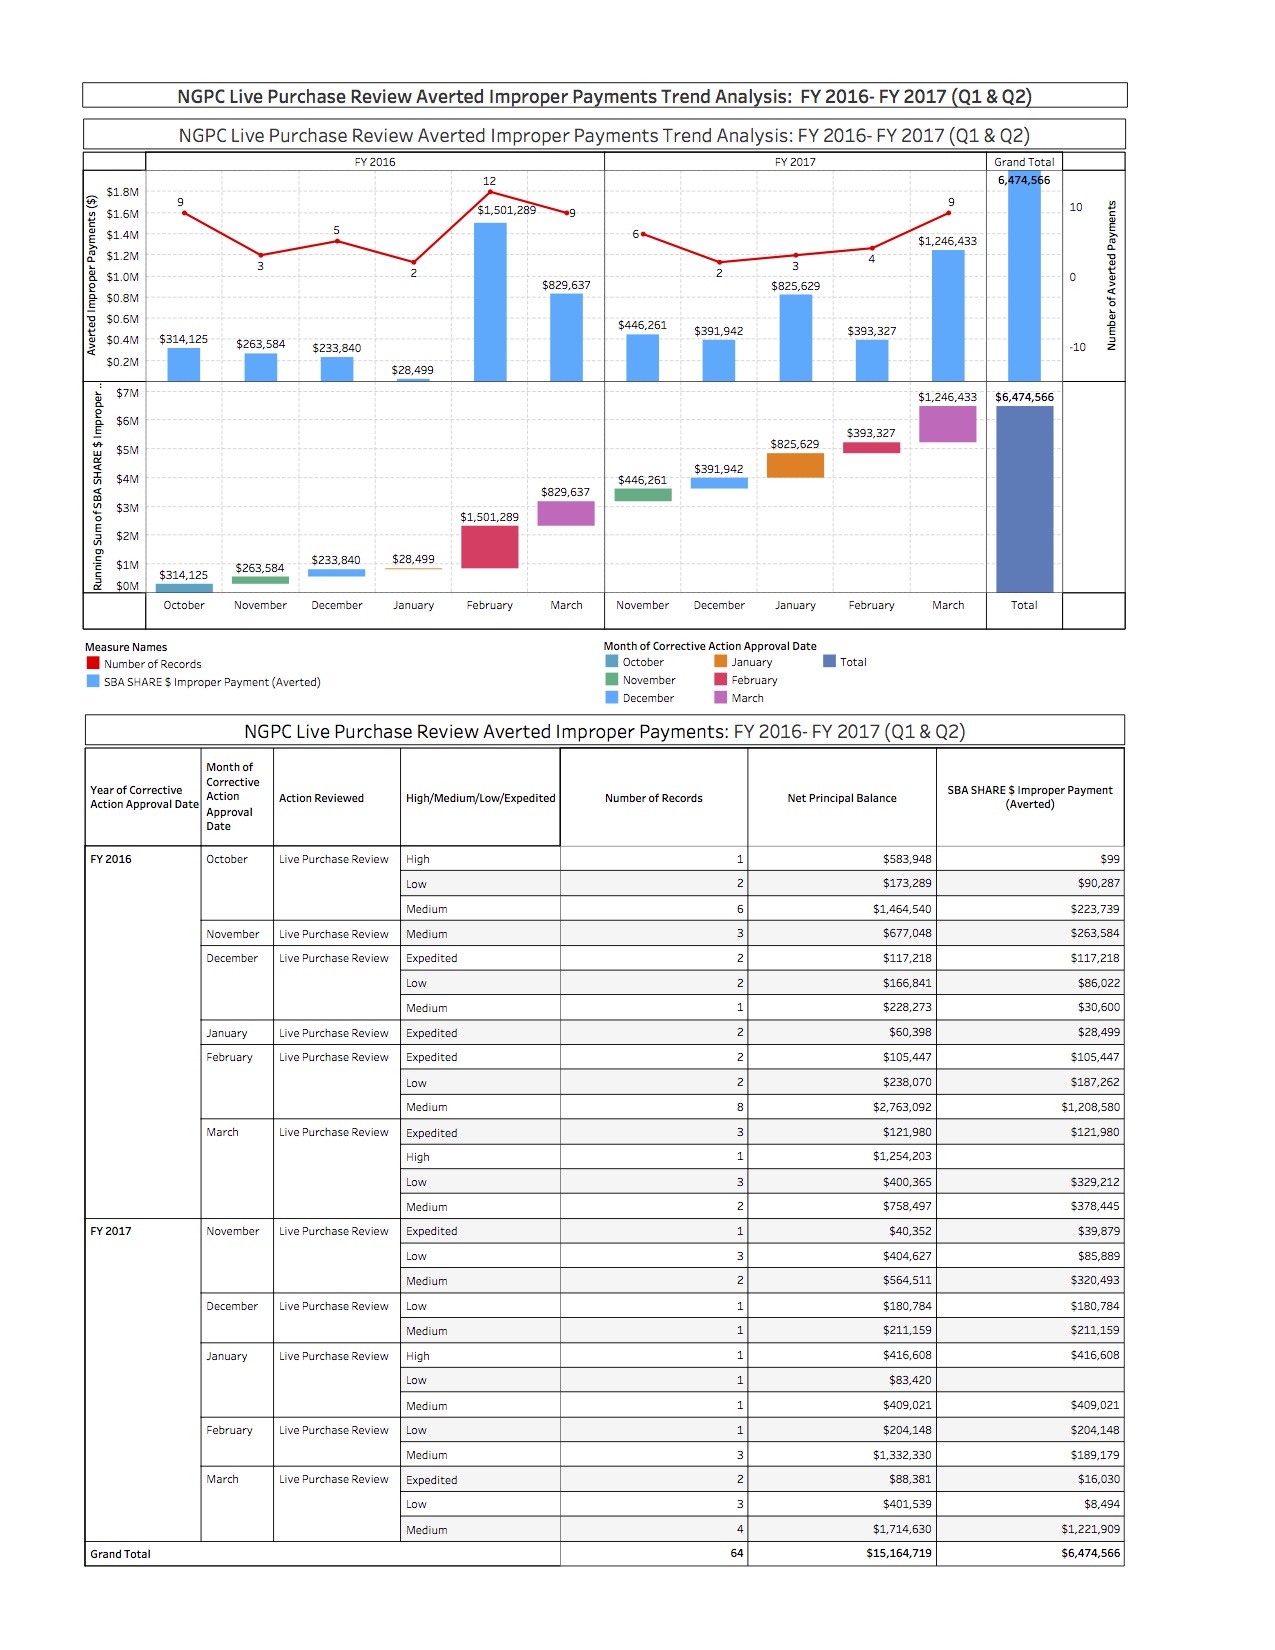
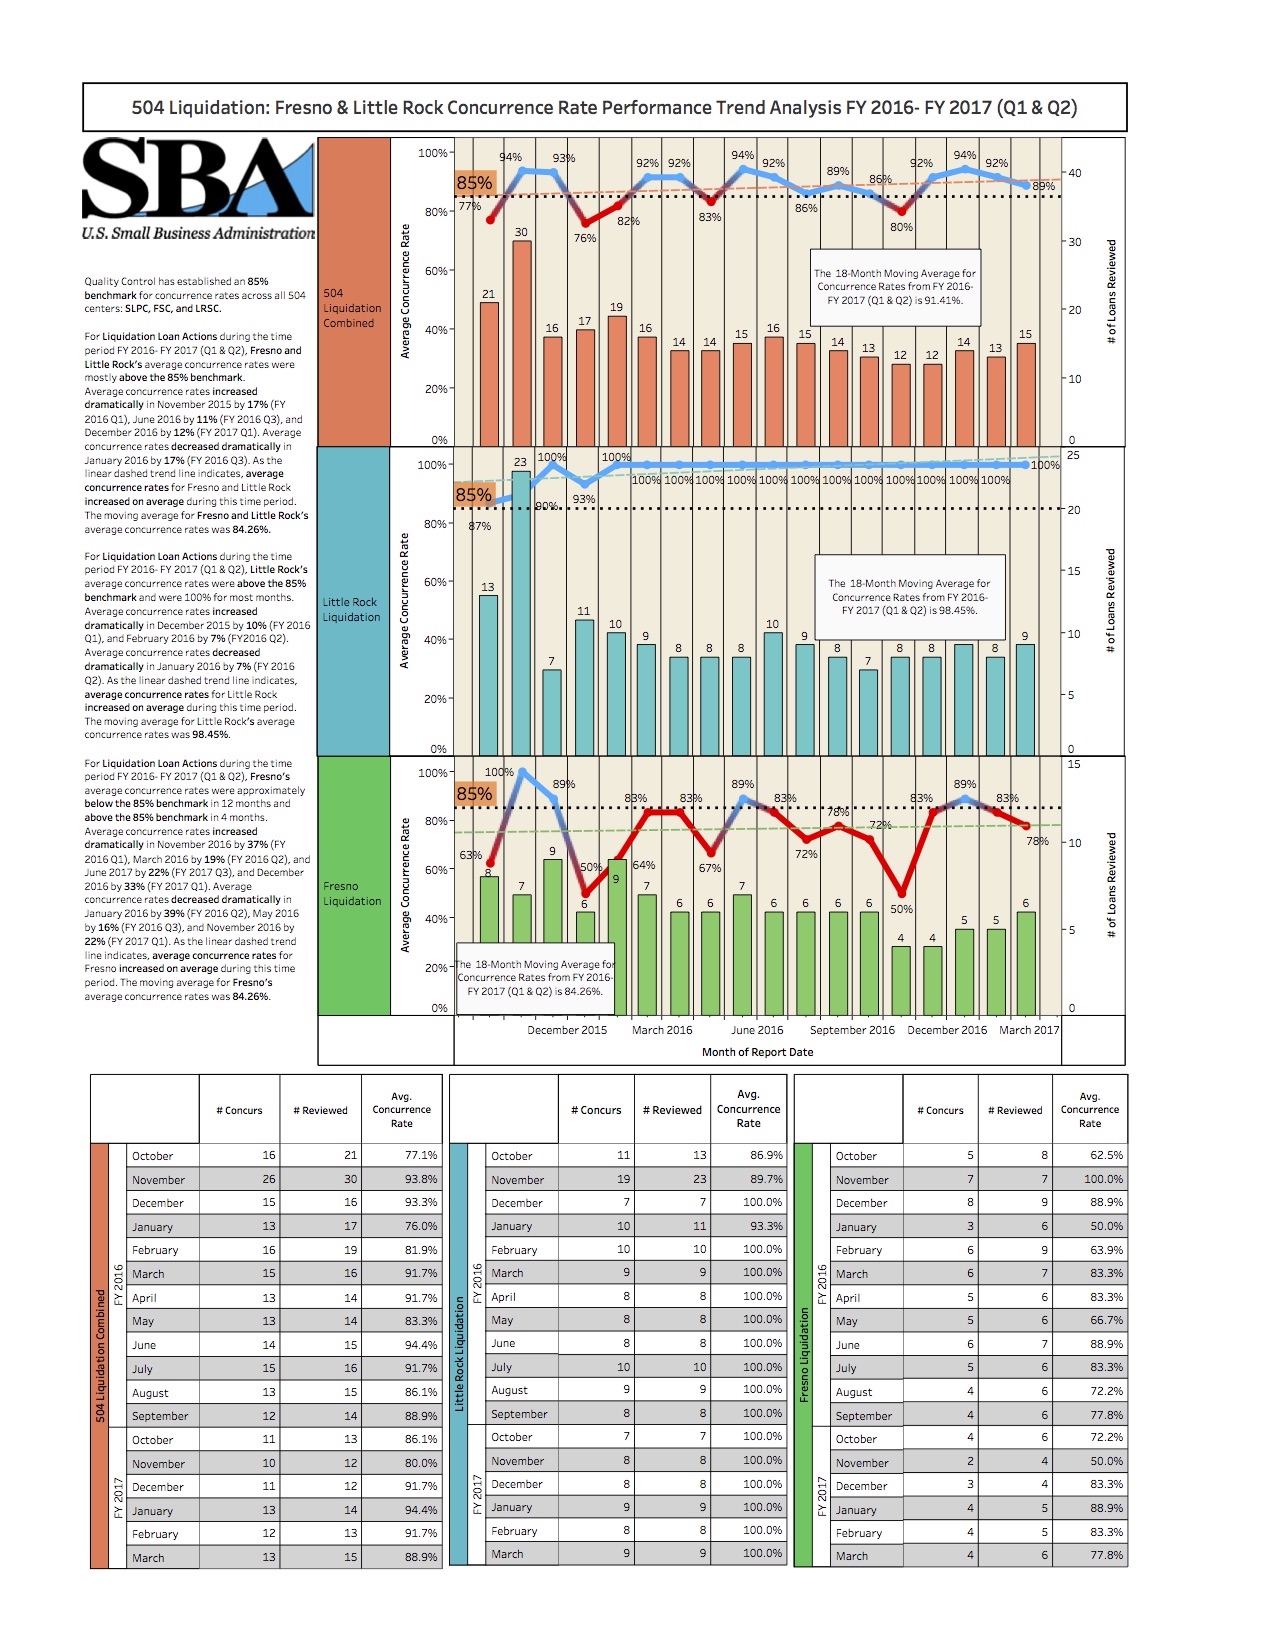
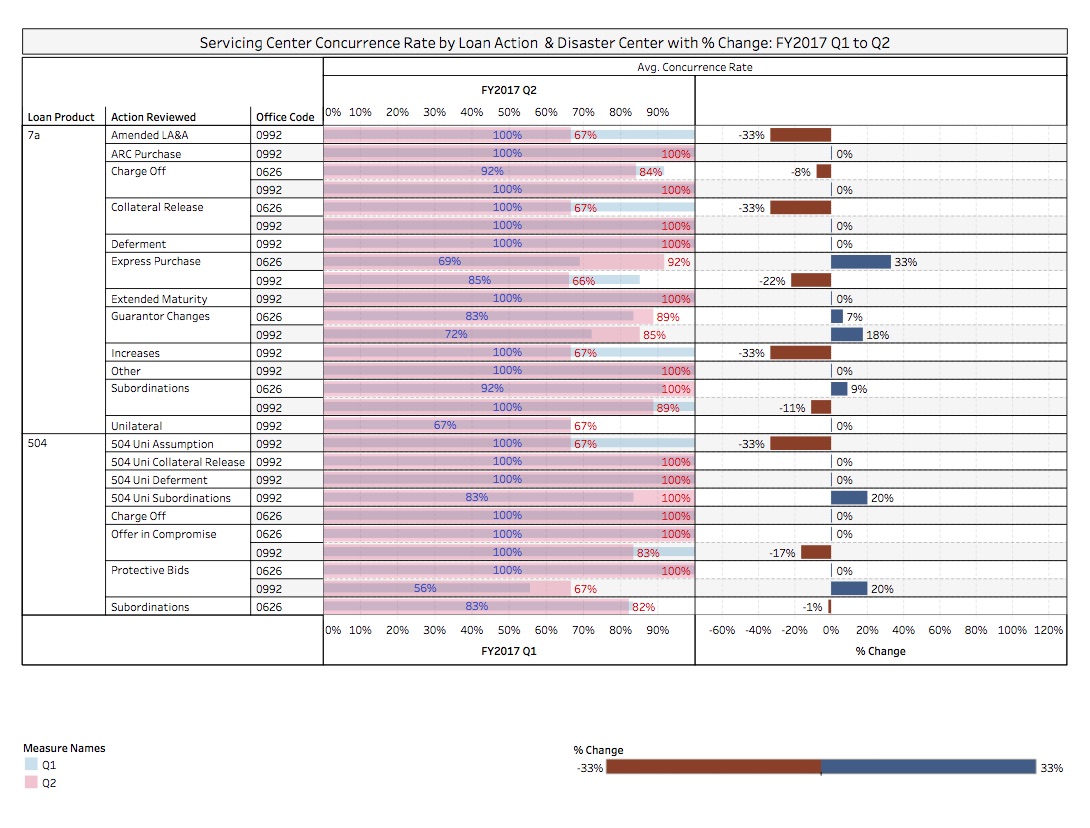
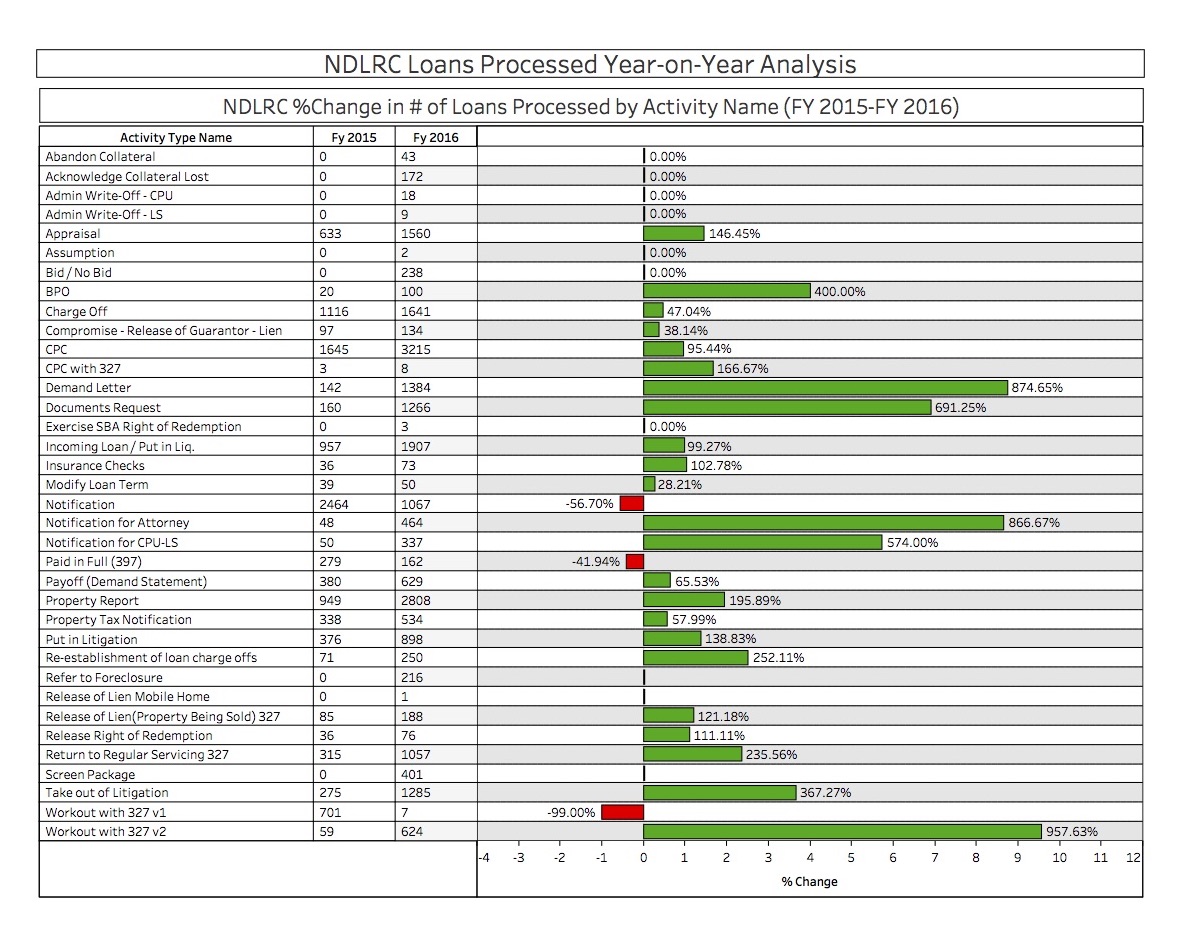
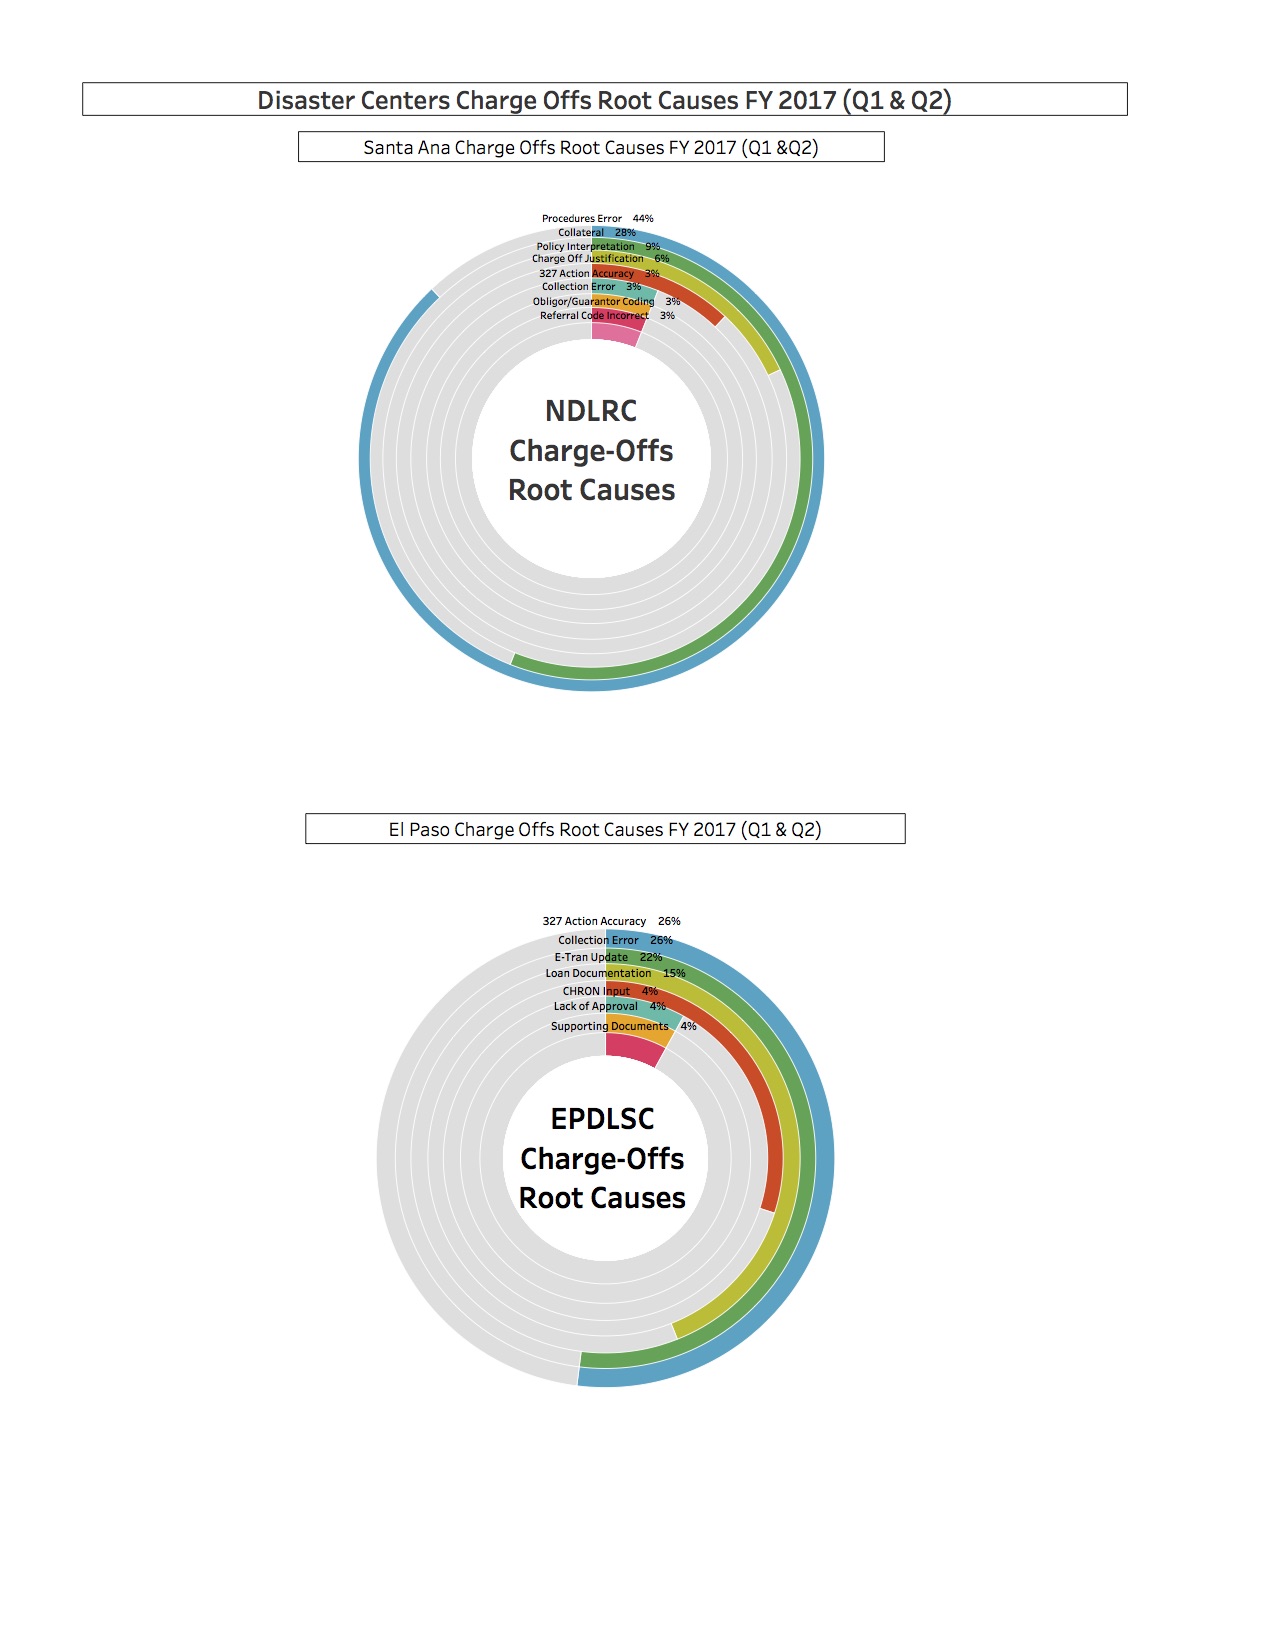
Tableau Dashboards for Quality Control of Loan Programs
Here are some of the dashboards I created. Although these are nice and concise, the process to create these was anything but easy. I had to restructure, merge, and manipulate data in excel. Once the I cleaned the data, I made these dashboards using the Tableau software to perform outlier and trend analysis. These also proved helpful to get a general sense of how each loan program or loan center was doing.