About Me
Hello there and welcome to my website. My name is Fernando Ramos. I graduated from the University of California Irvine (UCI) with a degree in economics and a minor in statistics in June 2018. My passions lie in the realms of programming, data analysis and web development. My ultimate goal is to either become a data scientist or a full-stack developer. To pursue the data science path, I will apply for various master's programs in statistics. My path to become a full-stack web developer would include mastering client-side and server-side programming concepts through ambitious self-study. I developed this website as a portfolio to showcase all of my technical skills and as an educational resource to help other people out. I have realized that to truly master concepts, you have to teach them in their most basic form. That, however, is easier said than done. As I progress, I hope that my programming blog is useful to many people that are trying to tackle certain intermediate statistical and programing problems. In the event that my blog becomes popular, I will separate it from this website to maximize efficiency.
Front End Development
As my development of this website signals, I am familiar with basic elements of HTML, CSS, and media queries/responsiveness. I also know how to develop websites in a Bootstrap framework. In fact, I plan to re-design and launch a new website using bootstrap and a different host/domain name sometime in the future. The primary reason that I originally designed this website using only HTML and CSS is that I wanted to deliberately stuggle with and learn the basics before utilizing other frameworks and tools. In retrospect, there's no doubt that I have grown an appreciation for Bootstrap and other frameworks because they simplify the process of web development significantly. I definitely see myself creating some web apps and will be linking them here.
Tableau
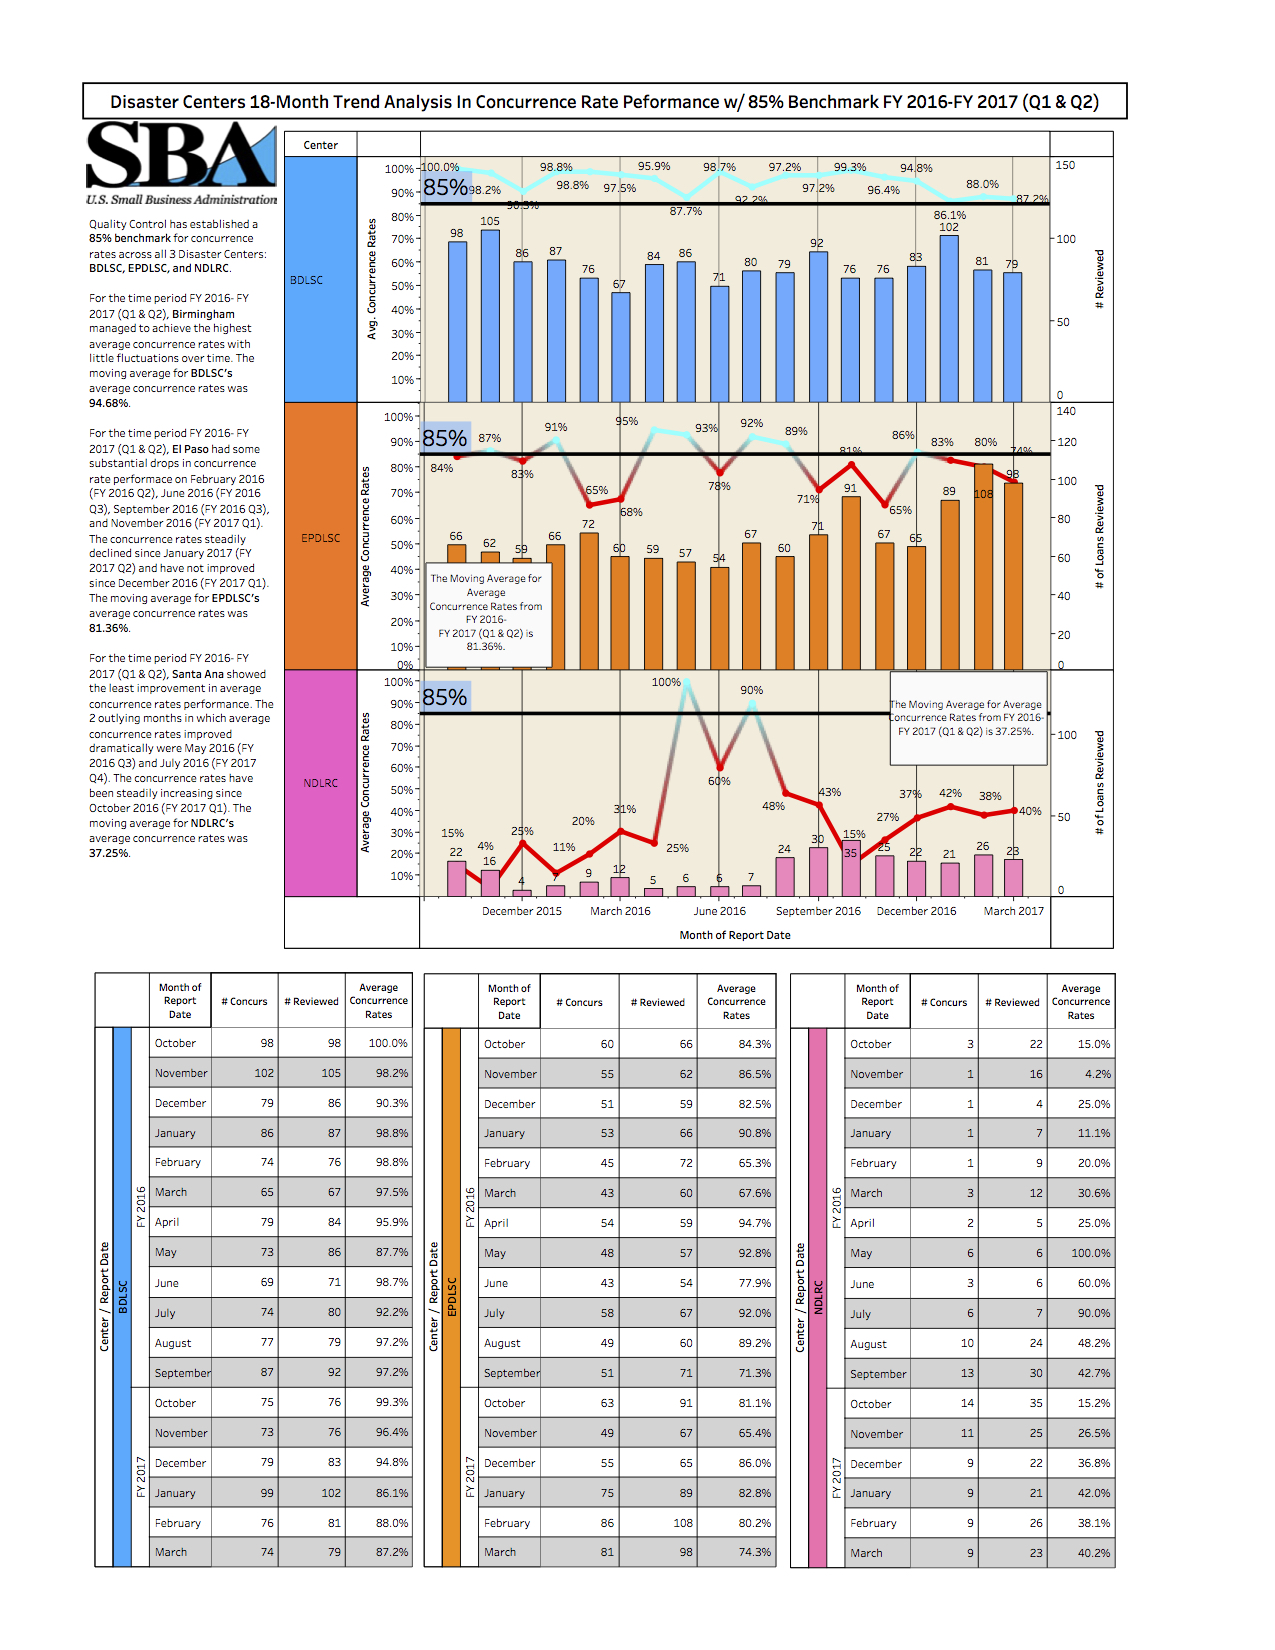
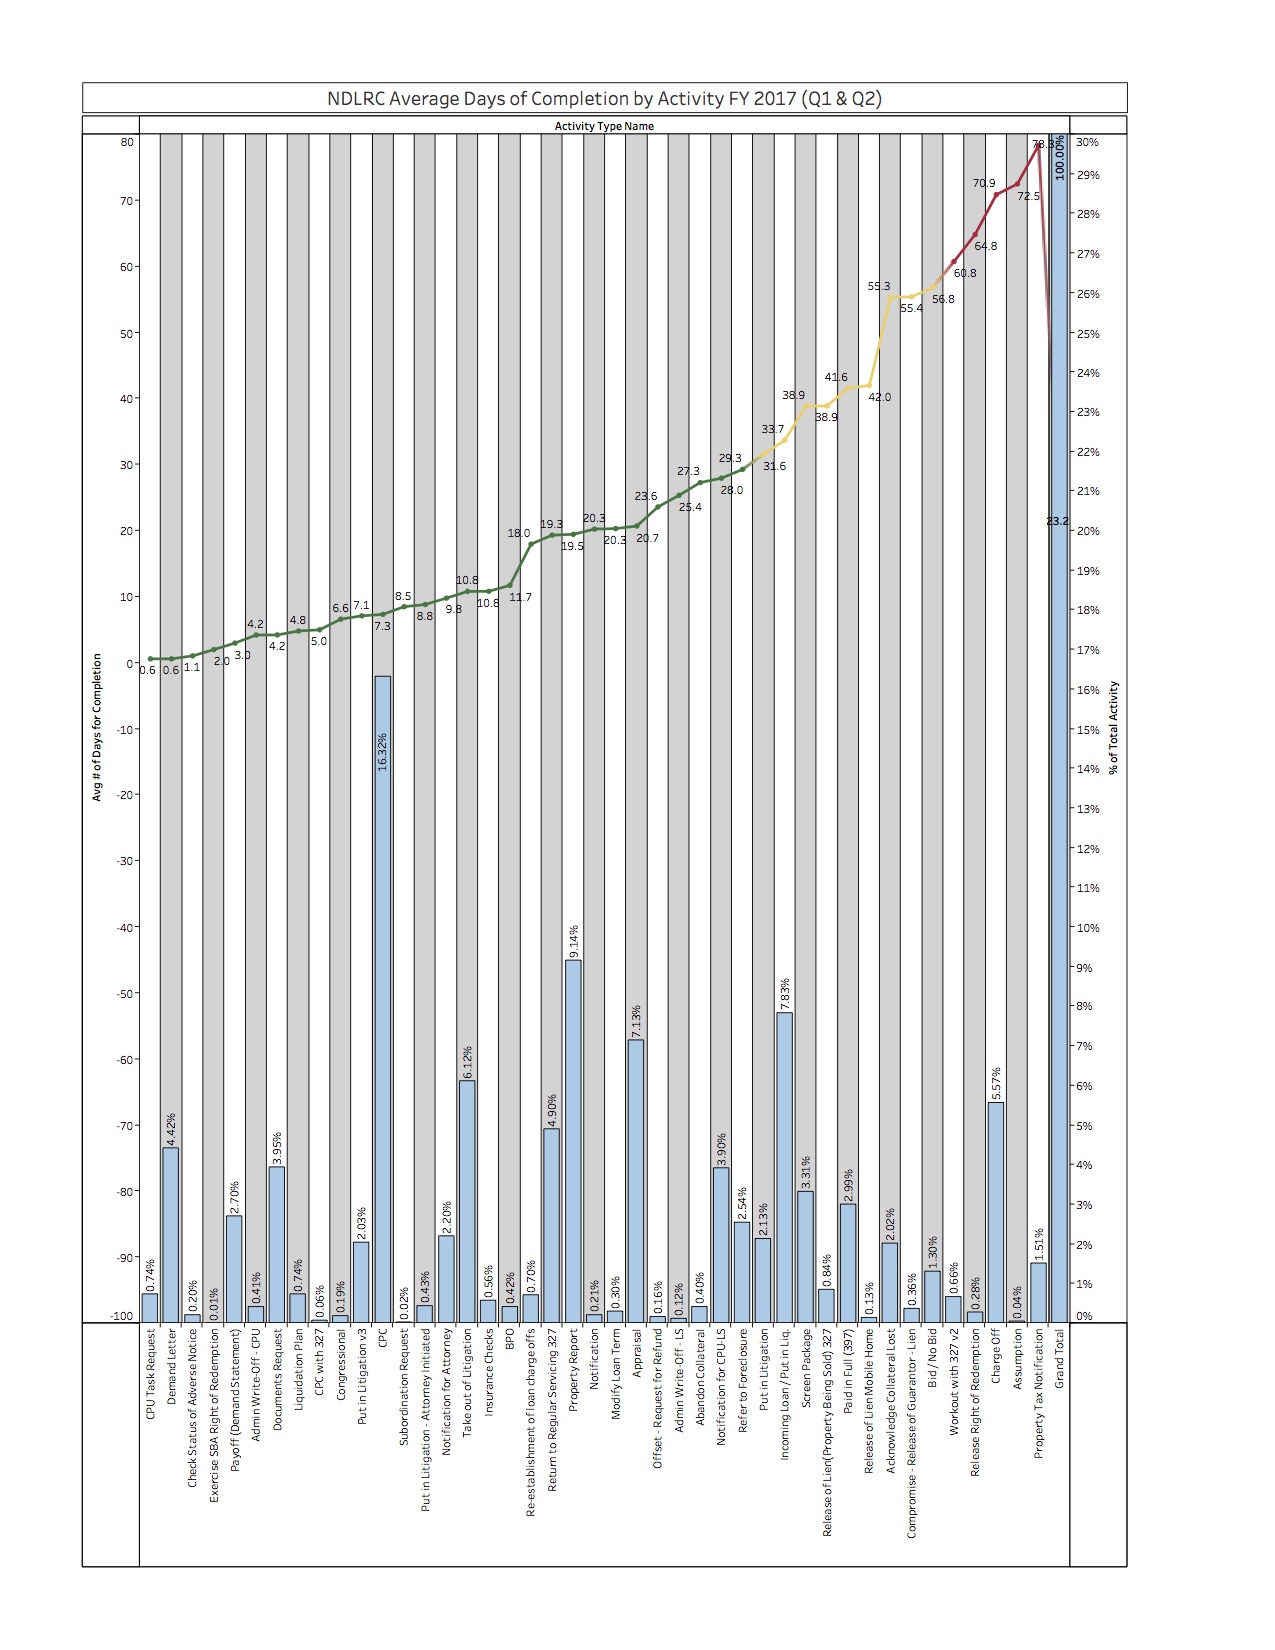
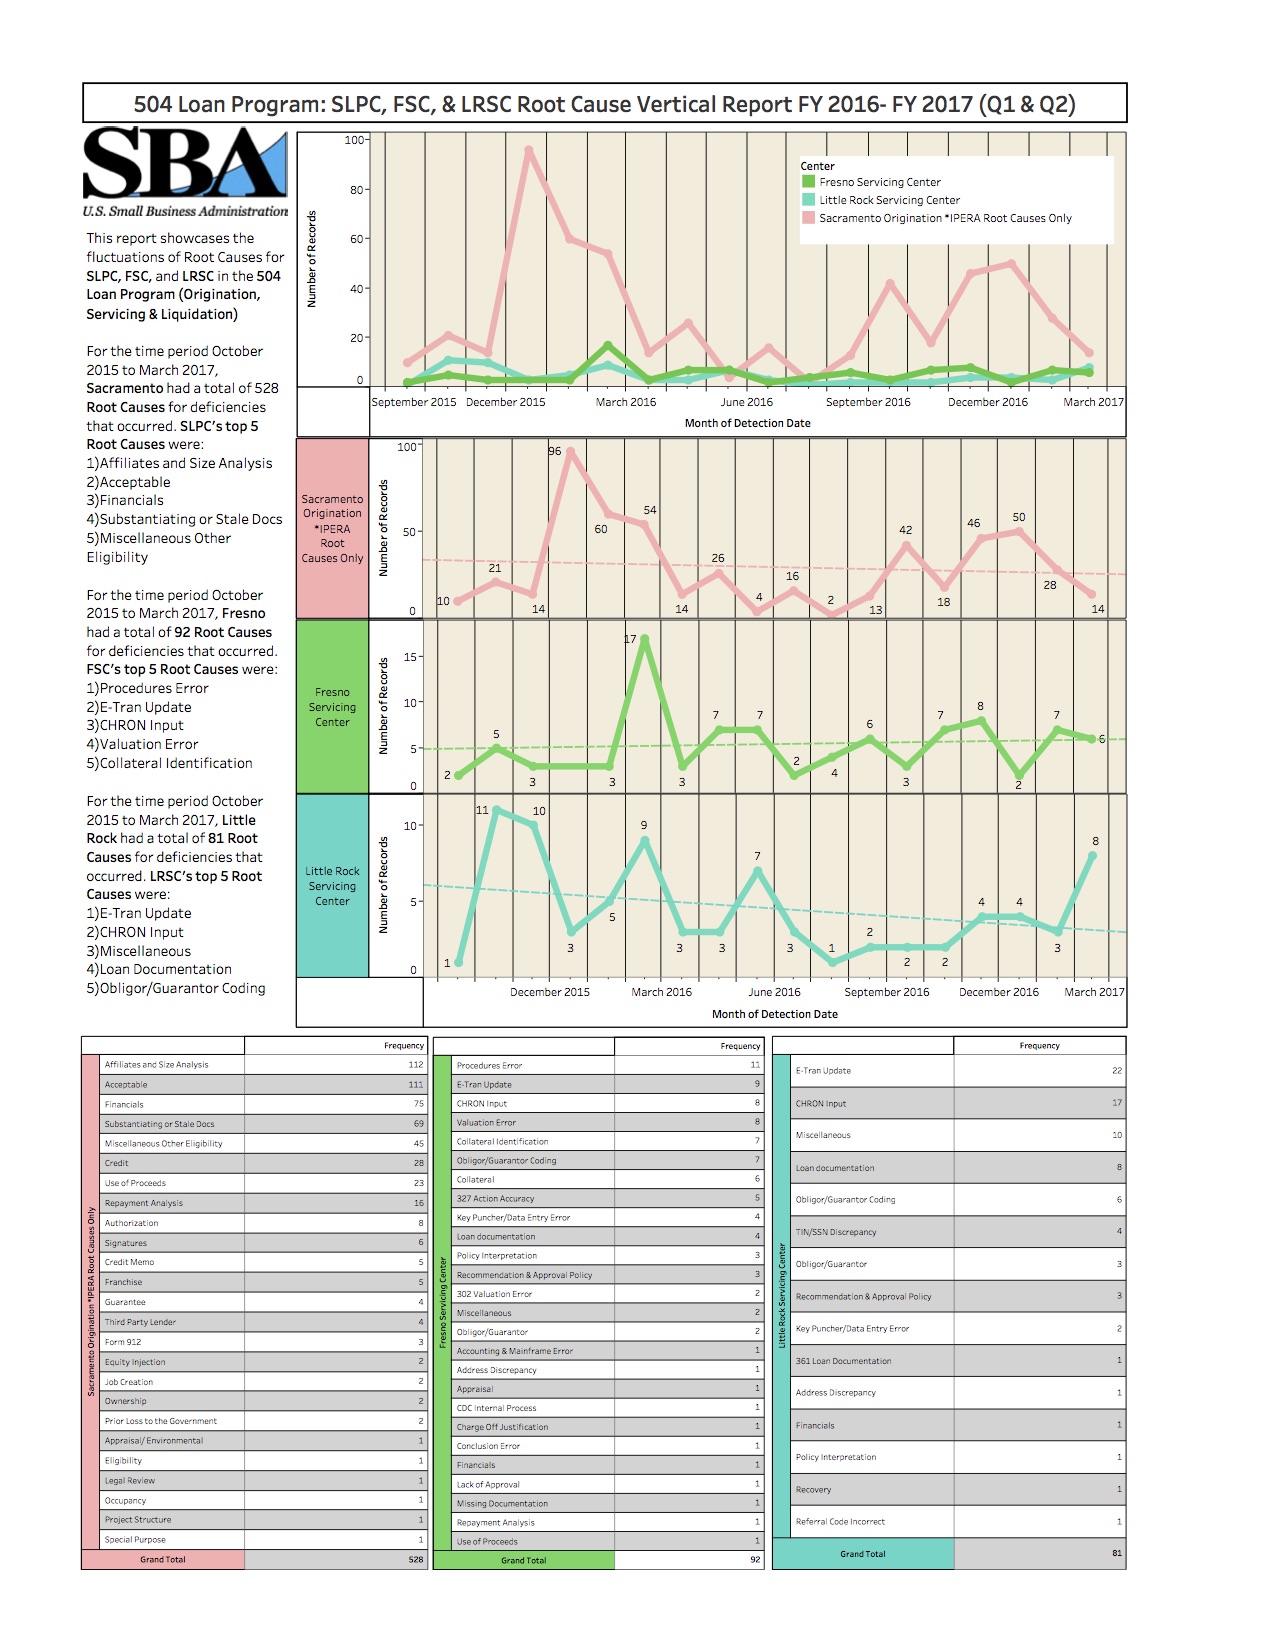
I learned how to make interactive visualizations, stories, and dashboards in Tableau in an internship I completed in Washington D.C Spring of 2017. The analytics I created using Tableau are in the "Experience" section of my website. Tableau is one of my favorite softwares to use when performing basic exploratory data analysis to get an idea of seasonality, trends, and other patterns that can be pinpointed through series of graphs and visualizations. I also like to use Tableau when manipulating data because their simple variable drag and drop tool can be useful when trying to restructure data in tables for ad hoc analysis that would otherwise be more complicated to do in Excel.
Featured Visualizations
Python & R
When it comes to using Python and R, I like to use R mostly for statistical purposes and Python for more general purposes. I particularly like using Python for some of my hobbies such as web scraping and video game development; and R for modeling and other multivariate statistical methods. However, I have grown to appreciate both, especially their open source nature and helpful community of programmers. I learned how to program in R through 2 sequences in applied and theoretical statistics which are detailed in the "Coursework" section of my website. I learned the basics of Python mostly on my own and then consolidated my understanding of the basics through an introductory programming class I took while I was an undergrad at UCI. The "Programming" section of my website shows how I utilize both programming languages to solve problems that I find interesting.